The old adage goes “you can’t improve what you don’t measure”, and it is true as ever for carbon emissions, so it is usually a good idea to start off by understanding where you stand vs peers.
I also think it’s worth getting your head around the big picture numbers first, and understand how that relates on a per capita basis. This way, when you zoom in to your own company or industry, you can get a feel for how important decarbonisation is going to be – is it an existential question that will turn the business upside down (as it will for cement) or it is something that is simply the right thing to do, even if the costs and effects might not change the world?
So let’s start!
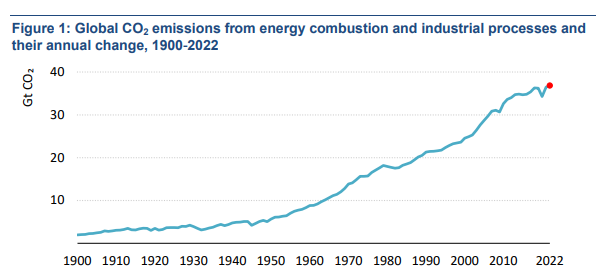
The headline figure is the global total amount of CO2 we emit – this is estimated to be around 37 billion tonnes (37Gt).
The exact number is uncertain because it’s a composite including a lot of estimates, and while fossil fuel data is getting better (see the International Energy Agency’s latest analysis from 2022), there are other emissions, for example from land use changes, that are still very challenging to nail down.
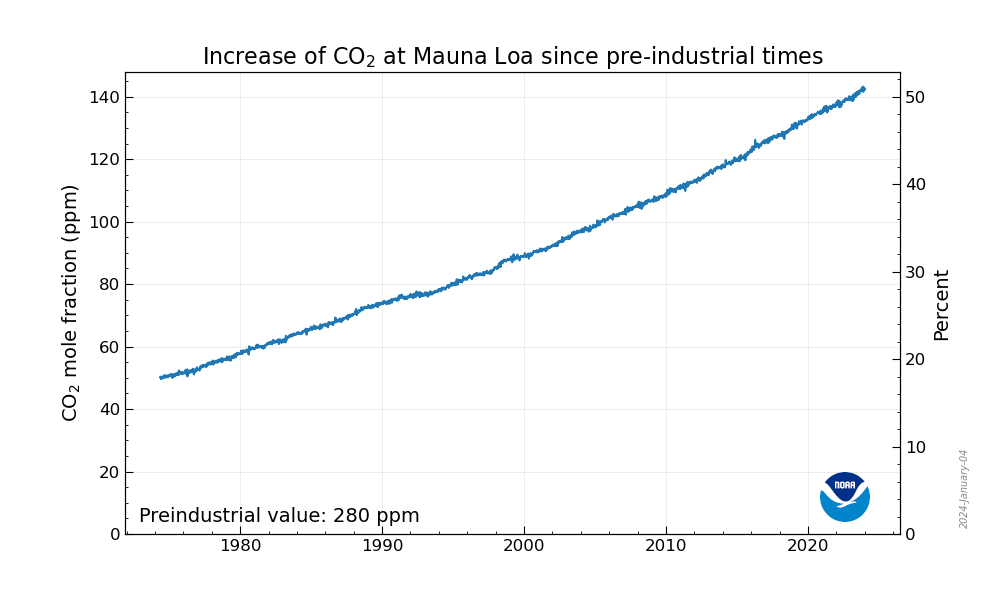
The trend (source) is of course alarming, and its effect on atmospheric CO2 (source) clear.
We can now zoom in on the main sectors (again from the IEA):
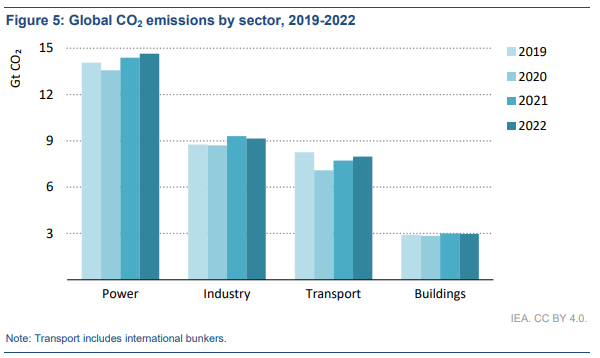
We can cut this up a million ways, but the key point is we need a way to ensure we direct our efforts wisely – We must not be “penny-wise, pound foolish”, on the other hand, some small emissions, like the washing of dishes or cooking of food, may be small individually, but are so frequent that even seemingly modest innovations in areas like these can have powerful effects.
It’s tempting to focus on the “big emitters”, electricity, steel, cement, aviation… but it has become clear that this won’t be enough – there are vast numbers of smaller businesses producing everything from food to clothes to electronics that still make up the bulk of industrial emissions.
There are also other ways to reduce CO2, that are not just about industry cutting it carbon. For example, we need better building insulation, longer lasting products and ways to reduce food waste. We need innovations across all our industries, we cannot just leave it to the power companies.
So all of us have a role to play, fine, but what about benchmarking?
Before we get to that I think it is helpful to give a few more “useful numbers” that we can use to give us more perspective as we zoon down from the global scale.
When we first started calculating our CO2 emissions perhaps 15 years ago, I recall being shocked by how high they were, but then even more shocked by high everyone else’s were too!
We had a fairly big kiln producing bricks which was emitting 20 thousand tonnes (20kt) of CO2 a year. This factory would look pretty innocuous to the public walking by outside, it does not look like a power station, it does not have any visible smoke – yet there it is, a single stack churning out 20 thousands tonnes of CO2, year-in, year-out. But what was more worrying, is that for a brick plant, it was very small.
So the next number I will give is 1MtCO2e/y, which is the emission from one single fairly standard cement-clinker plant. Yes, some are bigger, some are smaller, but that is the order of magnitude – 50 times bigger than my brick plant!
The second number is 10MtCO2e/y, which is the rough scale of emissions from one of the major standard integrated iron and steel works. Again, some are bigger others smaller. That is 500 brick kilns!
So our brick plant now looks pretty modest – However, there are heck of a lot of bricks used globally – in fact, altogether they are estimated they account for over 1 billion tonnes (1Gt of CO2e) of emissions (remember the global total is 37Gt!)
What this emans is, if I can find a way to seriously cut carbon on my 20kt brick plant, and it the idea can be duplicated… well the implications could be very serious.
A different way to gain perspective on the scale of emissions is to think on a per capita basis.
The next chart shows that people have gone from emitting substantially less than a tonne each, each year, to nearly 5t each.
Also worth noting is the fairly worrisome spread, with the USA (considering its size) the biggest outlier (source data).
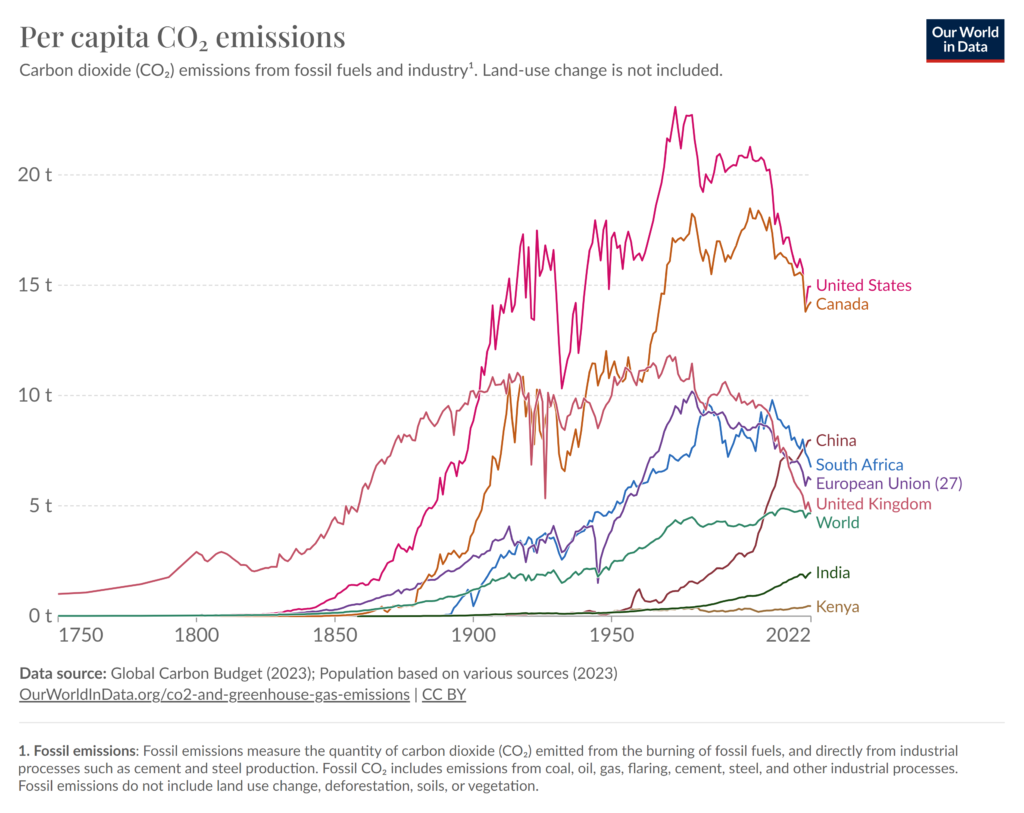
Of course this chart also hides that within countries disparities are even bigger – a frequent flyer can pass the global annual average emission in just a few flights: a single transatlantic flight emits more than 1tCO2e per passenger, our next number to remember.
Ok, we all know flying is bad, so what are our other big sources?
A key part of our personal footprints is our household emissions. Let’s imagine a house that consumes around 10kWh of electricity a day – that’s mid range for the UK, and, say, another 30kWh/day for gas which is used for cooking, hot water and heating. This is not untypical for the UK – though many other countries will require less heating, and others will require air conditioning instead. Finally, much of the planet does not have domestic gas on tap, but for I will stick with this for illustrative purposes.
So what does that mean terms of carbon? To answer that, the first thing we need to know the carbon intensity of our electricity supply.
We can simply ask our supplier for this info, which may depend on the tariff you have, as you can choose an all-renewable tariff from many suppliers these days. They should provide this info on a per kWh basis.
The number you get back will depend a lot on where you live – if you live in France, where there’s a lot of nuclear and a fair chunk of hydro, the value will be around 80g/kWh, the UK, which has good wind resources but has gas power stations as a backbone, emissions are around 260g/kWh. Finally the US around 360-380g/kWh, though this varies a lot by state. You can see how the carbon intensity of electricity supply varies on the map below (source OurWorldInData).
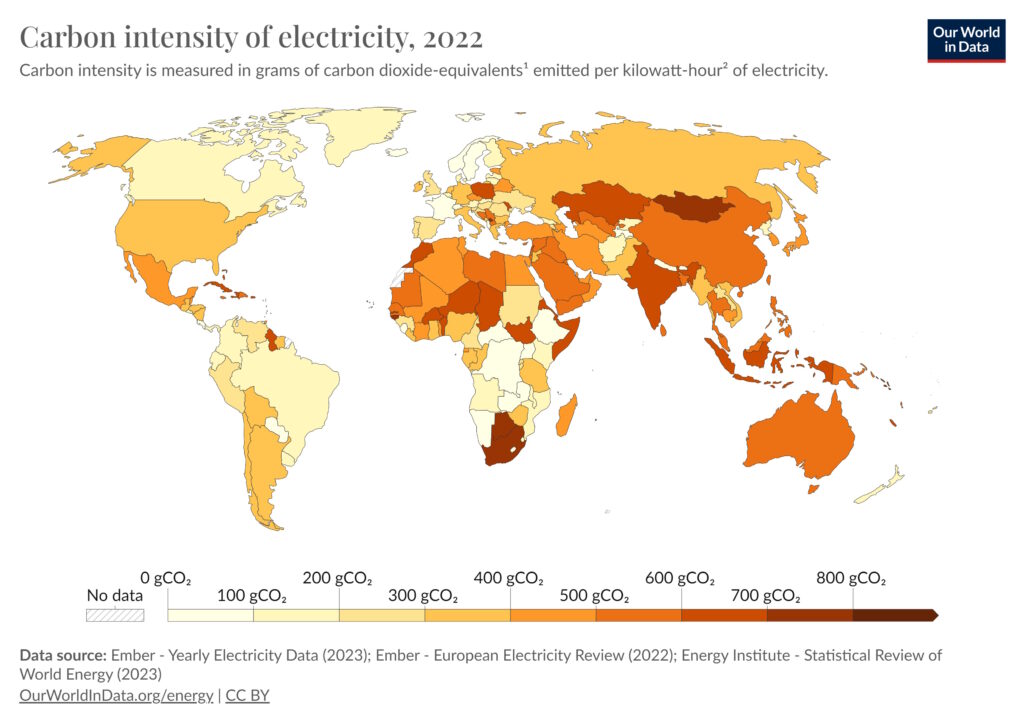
So, for our average house, we can expect 2.6kg a day of CO2 emissions from our electricity if it were in the UK – 800g in France – or nearly 4kg in the USA..
For the gas heating part, we can make the rough assumption that each cubic metre (m3) of gas you purchase contains around 11.2kWh of heat energy1 – and will produce around 2.2kg of CO2e when burned. So the household will emit (30/11.2)*2.2 or roughly 5.9kg of CO2 a day.
That takes us a to total of 7.5kg of CO2 a day, or over 2.7 metric tonnes a year. Of course, the house may have multiple occupants, but this makes up a fair chunk most people’s annual footprint.
So where does the rest of our personal tally come from?
Transport is a big one – and creates a big spread – those who drive a lot (especially single-occupant SUVs!) or fly a lot (especially in business class or, heaven forbid, by private jet) will tend to be well above average, while those who eschew planes and cars for trains, buses, or by staying home, bring back the average.
The bulk of the rest of our emissions are what we could call indirect – they are the carbon emitted on our behalf, to prepare the food we eat, to build the houses we live in, to deliver our goods and so on.
In a very real sense, therefore, we can say the smoke from the factories and power stations is our smoke, produced to satisfy our needs, and so in a very important way, is everyone’s responsibility.
Industrial Emissions
Now we have a feeling for the numbers, we can start to think about how we measure our industrial emissions.
At first it seems simple, just look at the fuel you are burning and the electricity you are buying, but when you start to do this you very soon realise that many of your emissions are not so easy to assess.
The help with the process, a system has evolved to break our emissions into three “scopes”:
- Scope 1 emissions – emissions from our own operations, CO2 (or other GHGs) that literally enter the atmosphere from our operations.
- Scope 2 emissions – indirect emissions that result from supplying us with energy (usually electricity).
- Scope 3 emissions – indirect emissions from up and down the supply chain – so the CO2 involved in making the raw materials we use, the further processing of our products, as well as the transport throughout the supply chain.
You can find out more about emissions scopes here2.
Calculating your Scope 1 & 2 Emissions
There is no shortcut here, you simply have to audit all your operations, and add them up – all the fuel you burn and all the electricity you buy.
You will need data on the CO2 emission factors for the fuels you use and the electricity you buy, and cross-check plant level data with company level data to make sure it all adds up.
You then have the trickier task of allocating those emissions to your products or services, as this is the number your customers will want. There are industry specific guidelines how to do this, but in general it is a some version of dividing your total emission by your total sales, that could be by unit, by mass or by sales value.
You will need to amke a range of judgement calls on these allocations, and take care to document the decision making process as any misallocation could later lead to accusations of greenwashing.
Scope 3 Emissions
As you probably already suspected, scope 3 is the really hard one… how do you find out the CO2 imbedded in everything you buy? How do you track what happens to your products after they are sold?
The good news is that you are not alone facing these hard questions. Supply chains are evolving and there is upward pressure on everyone to measure their scope 1 & 2 emissions and as they do, we can all start to complete the picture of our scope 3 emissions. Anyone who says they “know” their scope three emissions today is either in a very strange business, or is simply mistaken.
So, for scope three, the actions is clear: ask your suppliers to provide you with data, and start to set up a system to collate the data so it can be properly allocated to your own products or services.
That’s great for upstream – but what about downstream emissions?
Today, nobody really has this under control. There are however still concrete steps you can take:
- Talk to your customers about how they use your products/services to see if you can improve *their* emissions, or their customer’s emissions. This may be a welcome path to new and improved products. One example would be the development of better insulation, or more efficient motors – this would reduce the emissions associated with the eventual end-use of your products.
- Do a full life cycle assessment (LCA) of your products – this may identify ways to improve usage efficiency or reduce waste – perhaps you could take back offcuts, or provide a different size or shape of container that helps customers reduce waste. An LCA may also go to the “end of life” of the materials you provided and open up ideas about recycling/refurbishing, thus reducing the amount of virgin materials you need to meet the market needs.
- Review the logistics of your supply chain. Could you reduce shipping emissions by relocating production or warehousing? Can you find more sustainable logistics partners? Can you consolidate shipments or help customers to hold more stock or allow bulk shipments? Of course logistical cost saving is not new, but today we can put a virtual/internal carbon price into the decision making process to put more pressure on our partners to be sustainable.
Some Good News
One item of good news on scope 3 is that you can expect improvements soon without even lifting a finger – as the whole global economy is reducing carbon intensity already.
However, as a purchaser of goods and services, you still have a key role to play: your supply chain will wait for you to demand sustainable goods – so make sure you do.
Next Step: Benchmark against your peers
Once you have some decent estimates of your scope 1 and 2 emissions, and allocated them all to your products, you will no doubt be keen to compare with peers and competitors.
If you are lucky, they will already publish there own info on their website or product datasheets, but you may also find out from shared customers (though be wary of asking for anything confidential).
If the news is good, your carbon credentials3 could give you an edge in a competitive market. If the news is bad, it gives you a great reason to act – and perhaps to learn from your competition.
Summary
In this section, we had a quick tour of global emissions (37 billion tonnes), and see that some industries like bricks, cement and steel can account for several billion tonnes between them. We have seen that some large industrial facilities, like integrated iron and steel works can emit over 10 million tonnes a year from a single site.
We have seen that the world emissions have been rising, and approaching 5 tonnes per person per year, but that a single transatlantic flight alone accounts more than 1t.
We have learned that while some emissions are obvious, like smoke from a smokestack or exhaust pipe, many of our personal emissions are hidden, embedded in the buildings we inhabit or the food we eat.
“Industry” only exists to provide us with the goods and services we demand, so we need to demand more sustainable products so that industry will react.
The first step from industry will be to measure and report their footprints so that consumers can factor the environment into their purchasing choices and create a market incentive to be green.
To do this, each player in the supply chain, from the farm or the mine, needs to measure its own direct emissions and pass the info down the chain until we have the complete set.
This is a mammoth task, but we cannot wait for perfection, we all have to record and report what we can, and as a team build the puzzle to a complete, and greener, picture.
Footnotes:
- The gas we use can vary in composition, it may contain different ratios of methane ethane and propane and may even contain some water vapour, nitrogen and carbon dioxide. Your supplier should be able to give you the relevant heating values – of course there are different ways to interpret those, which I leave as an exercise for the reader. More important will probably be the efficiency of your gas boiler, which, if new, could be over 90%, but if not the latest model may be much lower. ↩︎
- The Greenhouse Gas Protocol is an attempt to standardise how we account for greenhouse gas emissions. There is no global or official rule book, so various systems have come into use – this one has gained traction with many large industrial companies and is best known, but many governments have their own methods and rules which can differ significantly in how emissions are measured, categorised and reported. ↩︎
- Note that there is much more to carbon when it comes to sustainability. Today the emerging best practice is to provide some sort of ondpendently verified report or certificate. One such system is Environmental Product Declaration (EPD) which covers carbon but also everything else needed to develop a lige cycle analysis through the supply chain – this could be water use, land use and more. ↩︎